


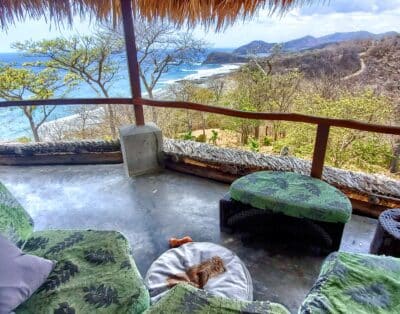


Considering going to Nicaragua but wondering when weatherwise is he best time to go? Look no further. We break it down for you here.
 CLIMATE AND AVERAGE WEATHER YEAR ROUND IN SOUTH PACIFIC NICARAGUA

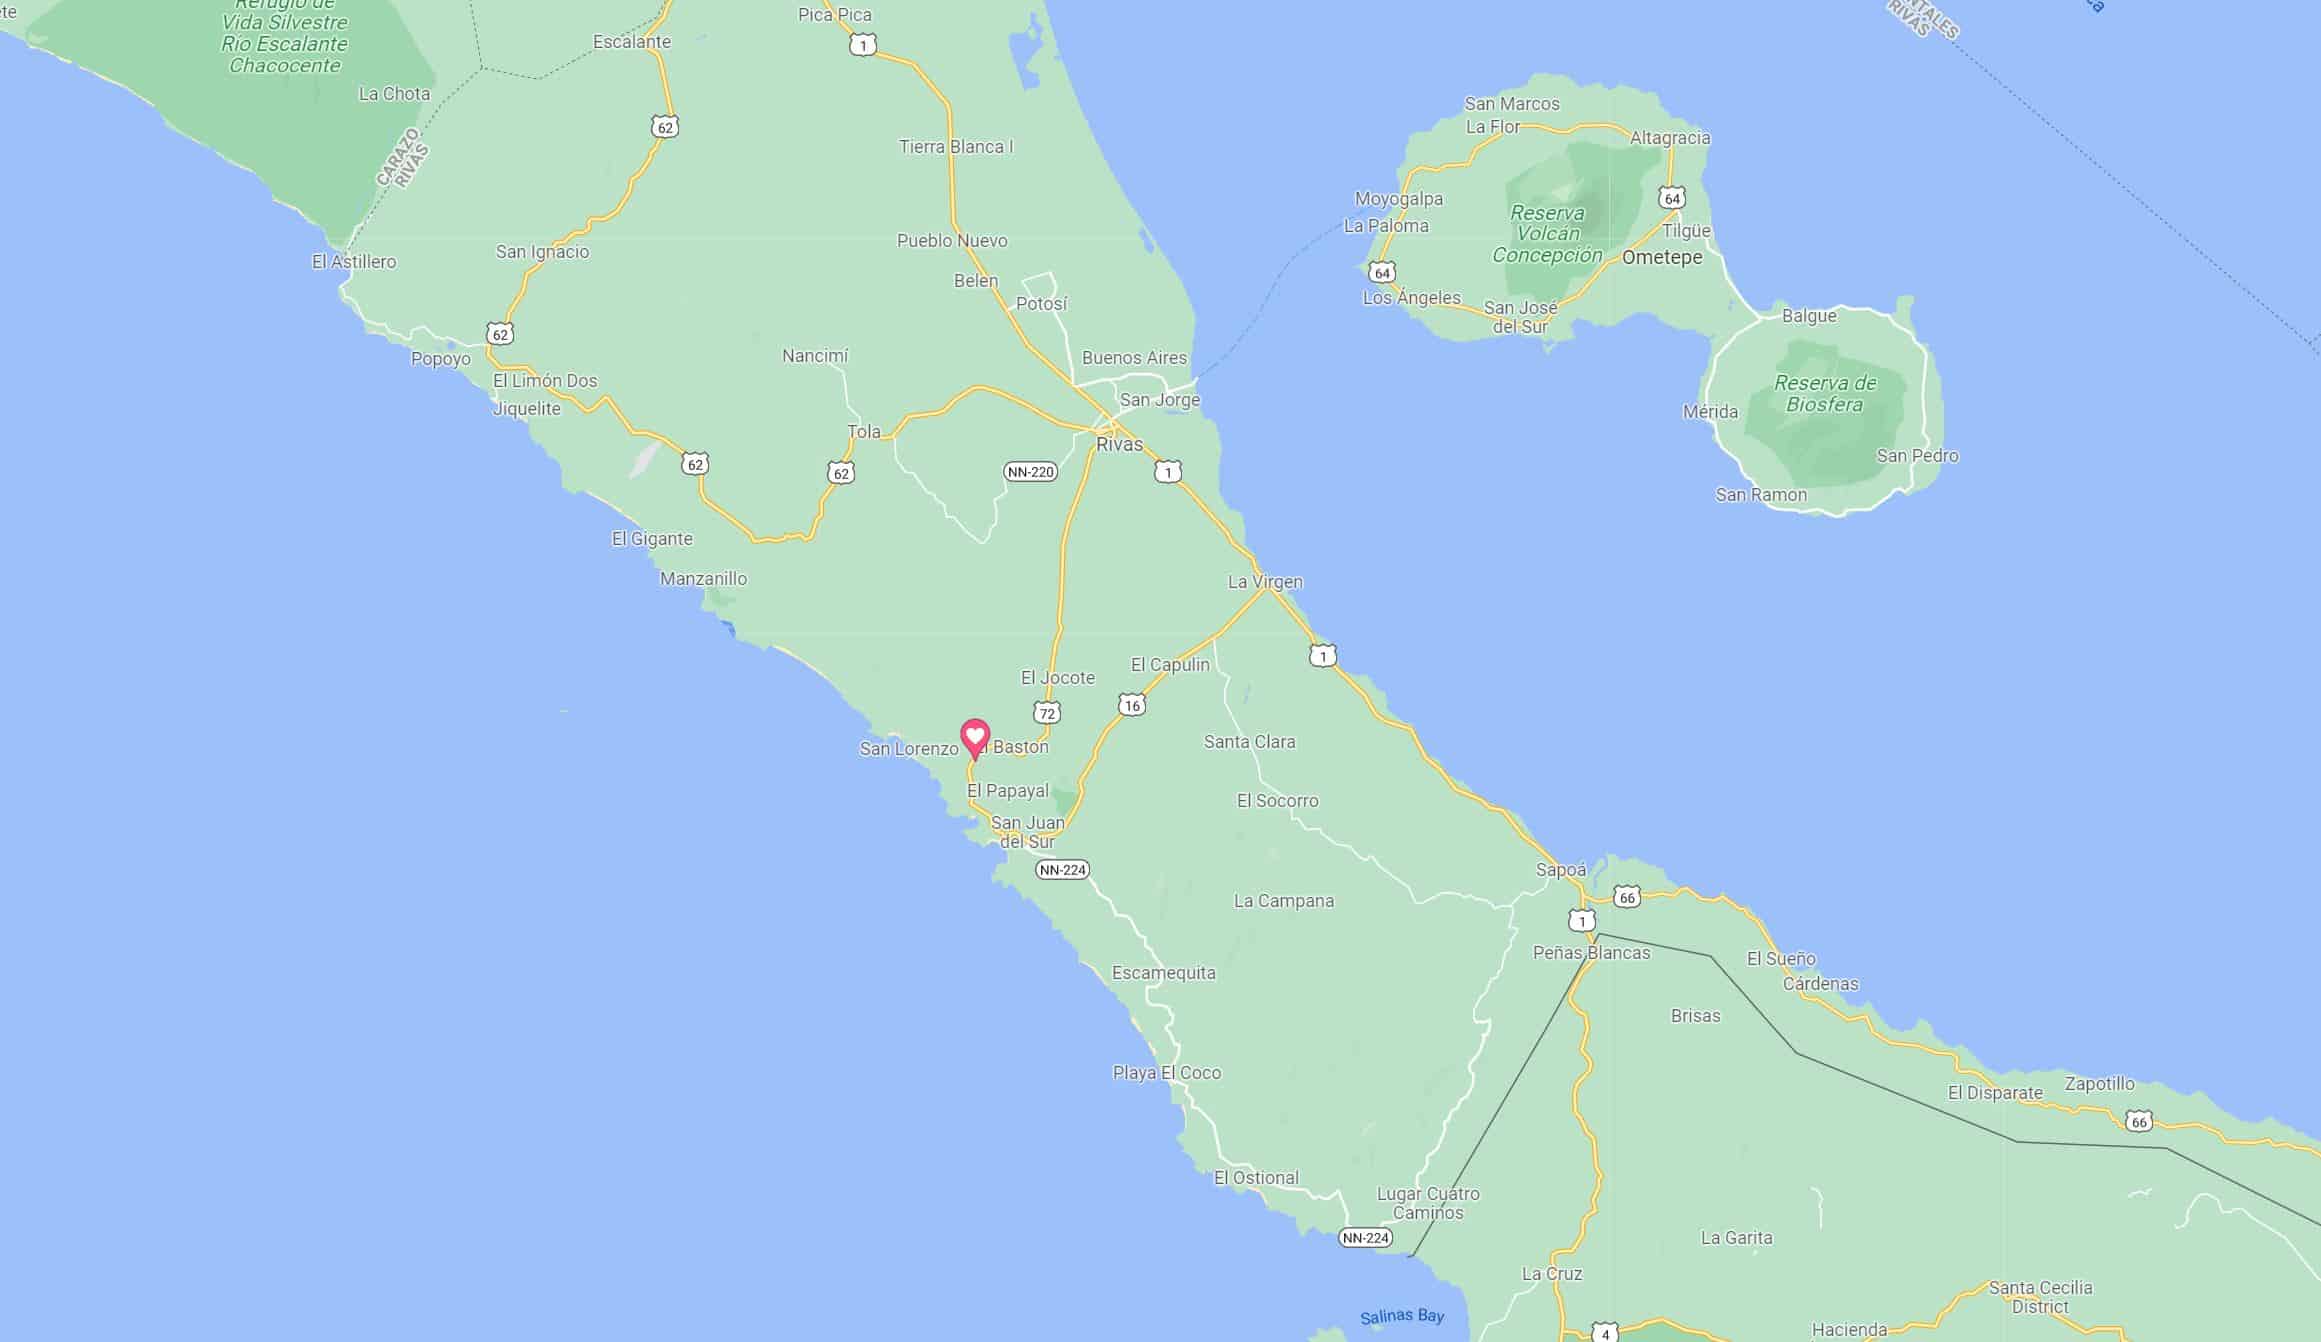
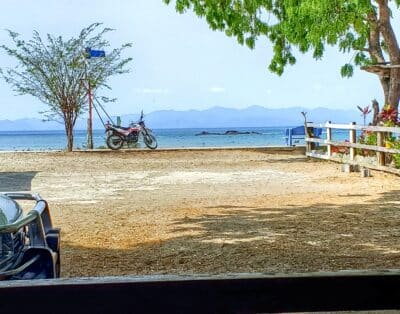
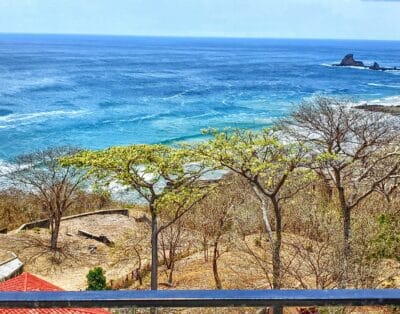
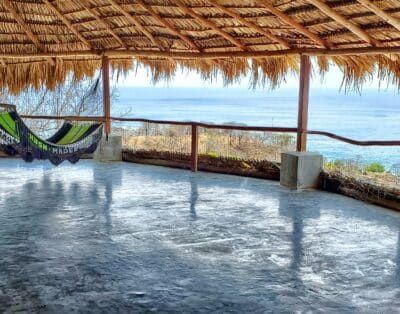
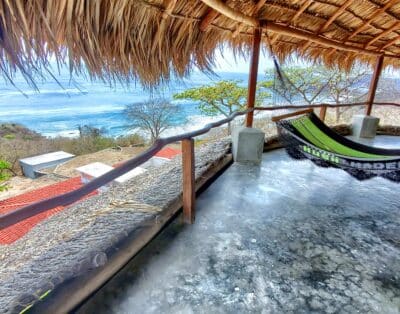
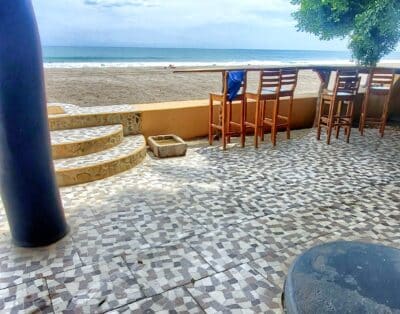
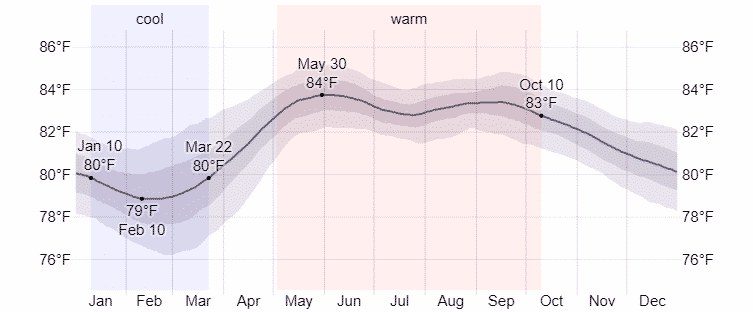
In San Juan del Sur, the wet season is overcast, the dry season is windy and partly cloudy, and it is hot and oppressive year round. Over the course of the year, the temperature typically varies from 74°F to 89°F and is rarely below 71°F or above 92°F.
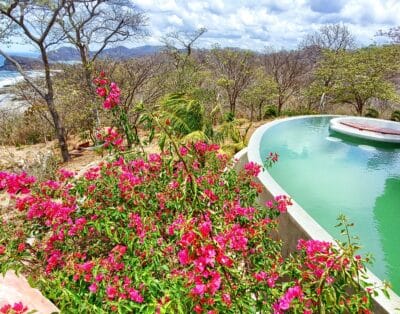
Based on the beach/pool score, the best time of year to visit San Juan del Sur for hot-weather activities is from early December to late March.

 AVERAGE TEMPERATURES IN SOUTH PACIFIC NICARAGUA
The temperature in South Pacific Nicaragua varies so little throughout the year that it is not entirely meaningful to discuss hot and cold seasons.

| Average | Jan | Feb | Mar | Apr | May | Jun | Jul | Aug | Sep | Oct | Nov | Dec |
|---|---|---|---|---|---|---|---|---|---|---|---|---|
| High | 85°F | 85°F | 87°F | 88°F | 88°F | 87°F | 86°F | 86°F | 86°F | 86°F | 86°F | 85°F |
| Temp. | 79°F | 79°F | 80°F | 82°F | 83°F | 82°F | 81°F | 81°F | 81°F | 81°F | 80°F | 80°F |
| Low | 74°F | 74°F | 75°F | 77°F | 78°F | 77°F | 77°F | 77°F | 77°F | 77°F | 76°F | 75°F |
PRECIPITATION

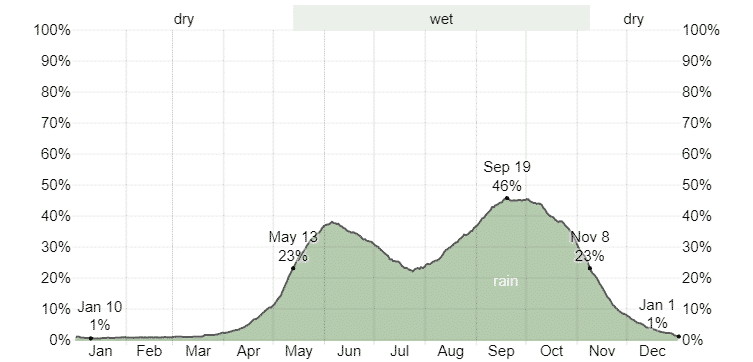
A wet day is one with at least 0.04 inches of liquid or liquid-equivalent precipitation. The chance of wet days in South Pacific Nicaragua varies significantly throughout the year.
The wetter season lasts 5.9 months, from May 13 to November 8, with a greater than 23% chance of a given day being a wet day. The month with the most wet days in South Pacific Nicaragua is September, with an average of 13.0 days with at least 0.04 inches of precipitation.
The drier season lasts 6.1 months, from November 8 to May 13. The month with the fewest wet days in South Pacific Nicaragua is January, with an average of 0.2 days with at least 0.04 inches of precipitation.
Among wet days, we distinguish between those that experience rain alone, snow alone, or a mixture of the two. The month with the most days of rain alone in South Pacific Nicaragua is September, with an average of 13.0 days. Based on this categorization, the most common form of precipitation throughout the year is rain alone, with a peak probability of 46% on September 19.
| Days of | Jan | Feb | Mar | Apr | May | Jun | Jul | Aug | Sep | Oct | Nov | Dec |
|---|---|---|---|---|---|---|---|---|---|---|---|---|
| Rain | 0.2d | 0.2d | 0.4d | 1.8d | 8.1d | 10.4d | 7.8d | 9.4d | 13.0d | 12.2d | 5.1d | 1.2d |
RAINFALL
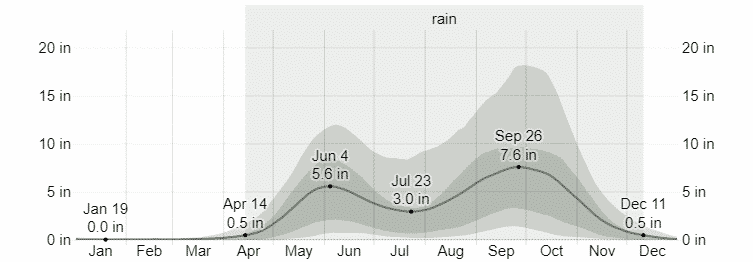
To show variation within the months and not just the monthly totals, we show the rainfall accumulated over a sliding 31-day period centered around each day of the year. South Pacific Nicaragua experiences extreme seasonal variation in monthly rainfall.
The rainy period of the year lasts for 7.9 months, from April 14 to December 11, with a sliding 31-day rainfall of at least 0.5 inches. The month with the most rain in San Juan del Sur is September, with an average rainfall of 7.1 inches.
The rainless period of the year lasts for 4.1 months, from December 11 to April 14. The month with the least rain in South Pacific Nicaragua is January, with an average rainfall of 0.0 inches.
|
WATER TEMPERATURE

This section reports on the wide-area average surface temperature of that water.
The average water temperature experiences some seasonal variation over the course of the year.
The time of year with warmer water lasts for 5.2 months, from May 3 to October 10, with an average temperature above 83°F. The month of the year in South Pacific Nicaragua with the warmest water is June, with an average temperature of 84°F.
The time of year with cooler water lasts for 2.4 months, from January 10 to March 22, with an average temperature below 80°F. The month of the year in South Pacific Nicaragua with the coolest water is February, with an average temperature of 79°F.
|
 BEST TIME OF THE YEAR TO VISIT
The tourism score favors clear, rainless days with perceived temperatures between 65°F and 80°F. Based on this score, the best time of year to visit South Pacific Nicaragua for general outdoor tourist activities is from mid December to mid March, with a peak score in the second week of January.
The beach/pool score favors clear, rainless days with perceived temperatures between 75°F and 90°F. Based on this score, the best time of year to visit South Pacific Nicaragua for hot-weather activities is from early December to late March, with a peak score in the first week of January.